
Enhancing Security in CPS Industry 5.0 using Lightweight MobileNetV3 with Adaptive Optimization Technique

The research work suggests a comprehensive strategy for improving performance and security in CPS applications, especially in Industry 5.0. To ensure high-quality, reliable data for more precise predictions, it starts with a strong data preprocessing pipeline for the IoT23 dataset that uses Gaussian filters to decrease noise, Mean Imputation (MI) to handle missing values, and Min-Max Normalization to standardize the data. In addition to deep feature extraction utilizing ResNet-101, the feature extraction procedure integrates statistical, time-based, and flow-based characteristics, which enhances the system’s capacity to recognize intricate patterns and behaviors. MobileNetV3 is used to maximize performance on edge devices. It is ideal for real-time data processing in CPS Industry 5.0 applications because it offers low computational cost, quick inference, and effective resource usage. Additionally, the work presents a new optimization method- CTPOA to optimize the hyperparameters of MobileNetV3, improving accuracy, generalization, and computing overhead. The incorporation of AES encryption and discretionary access control measures further protects data in CPS situations by reducing the risk of cyberattacks and preserving system integrity.
The system uses flow-based, time-based, and statistical data to identify various forms of DDoS attacks, including volumetric, protocol, and application layer attacks. In environments with restricted resources, MobileNetV3 guarantees effective real-time detection. The Chaotic Tent-based Puma Optimization (CTPOA) fine-tunes parameters to increase model accuracy. Additional security levels are provided via AES encryption and discretionary access control. Overall, by successfully recognizing and thwarting a variety of attack scenarios, the system improves cybersecurity. The complexity of the proposed model is determined by three important components: data preprocessing, deep learning model operations, and optimization. Data preprocessing, comprising Gaussian filtering, mean imputation, and Min-Max normalization, has a temporal complexity of \(\:O(N\bullet\:F),\) where \(\:N\) is the number of samples and \(\:F\) is the number of features. The depthwise separable convolutions used in the MobileNetV3 model, which is intended for edge devices, reduce complexity to \(\:O(N\cdot\:C\cdot\:H\cdot\:W),\) where \(\:C\), \(\:H\), and \(\:W\) stand for the number of channels, height, and width of the input, respectively. ResNet-101 feature extraction raises complexity to \(\:O\left(N\bullet\:H\bullet\:W\bullet\:L\right),\:\)where \(\:L\) is the model’s depth. The complexity of CTPOA, an optimization strategy that iterates across the population and feature dimensions, is \(\:O(N\cdot\:D\cdot\:T\)), where \(\:D\) is the number of dimensions and \(\:T\:\)is the number of iterations. When \(\:M\) is the number of data blocks, AES encryption adds to the \(\:O\left(M\right)\:\)complexity. Deep learning training and optimization account for the majority of the model’s difficulty, which scales with dataset size, model depth, and iterations. Space complexity is proportional to the amount of storage needed for the dataset, model parameters, and optimization population. The structure of the proposed system is illustrated in Fig. 2.

Architecture of the proposed Methodology.
Data collection
IoT23-dataset
The dataset named IoT23 is a real asset to security solution analysts and developers working on IoT devices, providing network traffic data. This dataset encompasses different kinds of IoT devices’ normal traffic such as sensors, actuators, real-time control, and home appliances. It has been annotated to represent a range of attack modes including DDoS, port scan, and botnet herding and consists of both normal and attack traffic. Each entry records the packet sizes, times of inter-packet flows, and the types of protocols used.
Pre-processing
The first stage of processing the IoT23 dataset is filtering which is used to eliminate noisy and irrelevant data, cleaning to select only relevant features, and data standardization to ensure uniform scaling. This model uses the combination of Gaussian filters, Mean Imputation, Min-Max normalization, and to preprocess the raw data collected from the IoT23 database. This process ensures that the input data to the deep learning models is devoid of noise, is normalized, and has no missing values, improving the quality of input and hence prediction accuracy.
Gaussian filter
In the specific context of the IoT23 dataset, Gaussian filtering corresponds to the smoothing techniques used to reduce noise and fluctuations in time series data regarding network traffic features. In contrast to the pixel operations involved in image processing, filtering in this case will be extended to sequential data points in features such as packet sizes, interpacket arrival times, or flow durations. In other words, the smoothed value is obtained by averaging the data points within a localized window of consideration, with the weighing function being a Gaussian. In contrast to the simple moving average where all the points in the window have an equal contribution, here the Gaussian filter assigns high weight to data points that lie close to the center of the window, thus keeping out noise while retaining the relevant trends. In particular, in working with a time series of the feature, say interpacket arrival time, for example, the Gaussian filter will smooth the sudden changes in packet timing. This will minimize any noise introduced due to temporary network anomalies or other irregular events and make patterns or trends within the network traffic visible. The noise reduction process is determined in Eq. (1).
$$\:H\left(t\right)=\frac{1}{2\pi\:{\sigma\:}^{2}}{exp}^{-\frac{{t}^{2}}{2{\sigma\:}^{2}}}$$
(1)
Where: \(\:H\left(t\right)\)represents the weight applied to the data point at time \(\:t\), \(\:\sigma\:\)is the SD of the Gaussian distribution (the higher \(\:\sigma\:\), the higher the degree of the relevant data). The Gaussian filter is applied by convolving the time-series data with the Gaussian function, so that there is an averaging effect on the data points weighted according to the Gaussian function.
Mean imputation (MI)
The MI approach is considered one of the simplest methods used to address the missing data within the noise removed (after gaussian filtering) IoT23 database. As a result, this process replaces the missing value (When network traffic data, such as packet sizes or flow durations, contains missing values) with the mean of the available values of the database. It maintains the data’s integrity, making sure the deep-learning model receives full dataset for training. The mean imputation for handling missing values is determined in Eq. (2).
$$\:Mean=\frac{1}{m}{\sum\:}_{j=1}^{m}{y}_{j}$$
(2)
Where \(\:m\) signifies the number of observed (non-missing) values of data points,, while \(\:{y}_{j}\)representing the observed values.
Min-max normalization
Min-Max Normalization is used on the IoT23 data set for scaling all numerical features, such as packet sizes or inter-packet arrival times, into a common range, typically [0,1]. This is very important to resist the potential unwanted influences of features on the deep learning model since those features may differ in scale. In addition, this enables stable and efficient training of the model by making all features compatible. The mix-max 2ormalization is determined in Eq. (3).
$$\:y{\prime\:}=\frac{y-{min}\left(y\right)}{{max}\left(y\right)-{min}\left(y\right)}$$
(3)
Where: \(\:y\) indicates the original value (acquired after imputation), \(\:{min}\left(y\right)\)and \(\:{max}\left(y\right)\)represents the minimum and maximum values of the feature (acquired after MI), \(\:y{\prime\:}\)indicates the scaled value(final pre-processed outcome).
Feature extraction
Feature extraction is defined as the extraction of useful information from pre-processed network traffic data that could be found in the IoT23 dataset. This is done to convert raw data into a model-friendly format for efficient evaluation by the deep learning model. Statistical, time-based, flow-based, and deep learning-derived features are extracted for the purpose in this study. Instead of using those features individually, the characteristics of network traffic data behavior are combined into a comprehensive representation before feeding them onto the deep learning model.
Flow-based features
Flow-based features that are extracted from an IoT23 dataset, are the flow duration, packet count, and bytes per flow from network traffic flows. They are crucial for identifying patterns that distinguish normal network behavior from that of malicious activities (like DDoS attack). The definition of flow-based features relies on the packets transmitted between a source and destination within a specified time frame. These features are crucial for distinguishing between the normal behavior from the hostile one.
-
Flow Duration: The duration of a network flow, indicating the time spent in a specific communication session. This feature helps assess, whether the flow behavior is normal or potentially malicious.
-
Packet Count (per Flow): The total number of packets exchanged within a single network flow. Anomalous traffic may exhibit statistically higher or lower packet counts compared to normal traffic.
-
Bytes (per Flow): The total number of bytes transferred during a network flow. This feature helps identify excessive or minimal data transfer, which can indicate anomalies.
-
Packets per Second (PPS): The rate of packet transmission within a network flow. High PPS values can indicate denial-of-service attacks.
-
Bytes per Packet (BPP): The average number of bytes per packet within a network flow, providing insights into packet size distribution.
Time-based features
Time-based features extracted from the pre-processed IoT23 dataset, such as inter-packet arrival time, active time, and idle time help in detecting temporal anomalies that can signify malicious activity, like timing irregularities in communication patterns. Such features are effective in identifying such temporal anomalies in the data generated from the network.
-
Inter-packet Arrival Time: Time difference between packets belonging to the same flow and, with variable lengths of the intervals, this property can symbolize an abnormality due to irregular traffic flow.
-
Active Time: total duration for a connection. Bursty traffic is expected to show much higher or lower values of active time as compared to normal behavior in the given network.
-
Idle Time: The time that a connection goes inactive. When such intervals of idle times become too long in comparison with the normal pattern of network operation, it may be suggestive of some malicious endeavors.
Statistics features
Statistical features like the mean, variance, skewness and kurtosis from the pre-processed IoT23 dataset will help quantify the distribution of packet sizes and thus identify abnormal traffic behaviors, associated with specific attacks.
-
Moments (Mean and Variance of Packet Sizes): The average and variance of packet sizes within a flow, characterizing the packet size distribution and aiding in traffic classification.
-
Skewness and kurtosis statistics: Higher-order statistical measures that quantify the asymmetry and “tailedness” of the packet size distribution, respectively. Abnormal values of skewness or kurtosis may indicate specific attack patterns.
Feature fusion is employed to complement the information revealed by flow-based, time-based, and statistical features extracted from the IoT23 dataset. It helps in integrating those diverse features into a single representation, thus making the model capable of complex pattern definition and anomaly detection in network traffic. The construction of this single, higher (dimensional) vector was accomplished by concatenating feature vectors corresponding to each category, including flow, time, and statistical. The fused feature vector provides a holistic view of traffic across both temporal dynamics and statistical properties, hence improving the precision of anomaly detection. The input to the deep learning model (ResNet-101) is the fused feature vector, allowing it to be learned from a richer and more informative representation of the data. This fusion method becomes important in understanding the complex relationships of dependence that are found between the different facets of network traffic and create a more suitable robust type of detection of cyberattacks.
Deep feature extraction using resnet-101
Following feature fusion, the combined feature vector from the IoT23 dataset is fed into the ResNet-101 model for deep feature extraction. ResNet-101 is employed because of its excellent ability to extract deep and hierarchical features that detect complex patterns indicative of cyberattacks from network traffic. The ResNet-101 architecture consists of five major convolutional modules and one hundred convolutional layers, followed by an average pooling layer and a dense layer. The shortcut connections are meant to cope with the degradation problem that normally arises with increasing network depth. In the case of a standard configuration of the binary classification, the cross-entropy instead is incorporated into the logical cross-entropy loss term as in Eq. (4):
$$\:{k}_{\left({h}_{j},{q}_{j}\right)}^{d}=-{h}_{j}{log}\left({q}_{j}\right)-\left(1-{h}_{j}\right){log}\left(1-{h}_{j}\right)$$
(4)
The ground truth as well as projected values for the \(\:{j}^{th}\)training database is indicated by \(\:{h}_{j}\)and \(\:{q}_{j}\). The CNN model backpropagates the loss value \(\:{k}_{\left({h}_{j},{q}_{j}\right)}^{d}\)and gradually optimizes its parameters (weights and biases) until it converges to a solution. Figure 3 illustrates the framework of ResNet-101 for deep feature extraction.

Architecture of ResNet-101.
The anomaly score measures how much data points deviate from typical behavior patterns following the extraction of deep features from the IoT23 dataset using ResNet-101.
Anomaly score based on distance metrics
The anomaly score measures how “far” the data is from a set of normal behavior patterns in the pre-processed IoT23 database. It uses distance-based measures to assess how different a given network flow or packet is from the predetermined baseline traffic characteristics. Mahalanobis distance is a common distance metric that varies based on the feature space. The Mahalanobis distance metric accounts for the correlations of the data set, which is particularly useful when the features are correlated and have different scales. The anomaly score using Mahalanobis distance is determined as per Eq. (5).
$$\:{D}_{M}\left(x,y\right)=\sqrt{{(x-y)}^{T}\cdot\:{S}^{-1}\cdot\:(x-y)}$$
(5)
Here. \(\:x\) and \(\:y\) are the data points, and \(\:{S}^{-1}\) represents the inverse covariance matrix of the dataset. Following anomaly score computation based on distance metrics, the resulting feature vectors from the IoT23 dataset are fed into MobileNetV3.
Lightweight MobileNetV3 for edge computation
MobileNetV3 has been selected for this study because of its computationally efficient and lightweight design, which makes it perfect for resource-constrained edge devices, which are typical in Industry 5.0 Cyber-Physical Systems (CPS). MobileNetV3 employs depthwise separable convolutions, linear bottlenecks, and Squeeze-and-Excitation (SE) blocks to drastically lower model size and computational complexity while preserving high performance, in contrast to conventional convolutional neural networks (CNNs), which demand a substantial amount of processing power. In CPS, where resources at the edge are limited and quick decisions are crucial, this is especially crucial for real-time anomaly detection and security threat mitigation. Furthermore, MobileNetV3 has proven to be more robust and capable of handling complex tasks with minimal computational load in related domains, such as mobile and Internet of Things applications, where it has been successfully applied to tasks like object detection, face recognition, and visual asymmetry detection. MobileNetV3’s success in these domains suggests that it will enhance CPS security by processing massive amounts of data effectively for attack identification and anomaly detection without overloading edge devices.
MobileNetV3 is built to be a compact & performant CNN model for mobile and edge use cases. It also leverages some of the advancements made in MobileNetV1 and V2, while also achieving some improvements in terms of processing and time efficiency. The input data is subjected to a standard convolutional layer with a considerably larger kernel size. These include a series of depthwise separable convolutions interleaved with linear bottlenecks. Each convolution operation consists of several stages of depthwise convolutional operation that applies a single filter for each channel \(\:X\) for the input tensor and which is output after depthwise convolution called \(\:{X}_{dw}\)convoluted tensor.
$$\:{X}_{dw}=depthwise\_Conv\left(X\right)$$
(6)
Equation (6) is followed by a pointwise convolution (\(\:1\times\:1\) convolution to combine channels) as defined in Eq. (7), in which
$$\:{X}_{pw}=pointwise\_Conv\left({X}_{dw}\right)$$
(7)
Linear bottleneck layers include a linear layer without non-linearity to help maintain the representational capacity of the model. Moreover, Squeeze-and-Excitation (SE) blocks are used to recalibrate channel-wise feature responses, allowing the network to focus on more informative features. The squeeze operation is applied as given in Eq. (8), in which \(\:S\) represents a vector representing the global average pooling of the input tensor \(\:X\).
$$\:S=GlobalAveragePooling\left(X\right)$$
(8)
Equation (9) defines the excitement operation, in which \(\:{W}_{1}\) and \(\:{W}_{2}\) specify the learning parameters, and \(\:\sigma\:\) signifies the sigmoid activation function.
$$\:Z=\sigma\:({W}_{2}\cdot\:ReLU({W}_{1}S)$$
(9)
The scaling operation is explained in Eq. (10), in which \(\:{X}^{{\prime\:}}\) stands for the output of the SE block after scaling the input \(\:X\) with the excitation vector \(\:Z\).
$$\:{X}^{{\prime\:}}=X\cdot\:Z$$
(10)
The final layer ends with a few fully connected (FC) layers or a global average pooling layer, followed by a classification head (sigmoid layer) as shown in Eq. (11), in which \(\:\sigma\:\left(X\right)\) means to sigmoid function applied to \(\:X\).
$$\:Swish\left(X\right)=X\cdot\:\:\sigma\:\left(X\right)$$
(11)

MobileNetV3 architecture.

Lightweight model with Quantization and Pruning architecture.
Thus, MobileNetV3 integrates all these strategies in a manner that achieves a good level of accuracy while minimizing the computational resources used. This makes it very appropriate for use at the edges where there are limited computational devices. The introduction of depthwise separable convolutions, linear bottlenecks, and SE blocks helps to minimize the size and computation of the model without performance deterioration. The fundamental structure of MobileNetV3 is illustrated in Fig. 4. Figure 5 shows the lightweight Architecture of the proposed model. The parameters and their corresponding values are shown in Table 2.
Quantization is reducing the number of bits used for the model’s weights and activations (e.g., converting 32-bit floating-point values to 8-bit integers). This reduction assists in decreasing model size and simultaneously accelerating the inference speed by utilizing the hardware optimized for the lower-bit procedures. The main conceptual contribution of quantization is to reduce the memory storage and computation requirements for deep learning models so that they can be effectively utilized on edge devices where resources are limited, a setting very common in Cyber-Physical Systems (CPS). Generally, quantization allows for somewhat diminished precision of the presented model; in return, quantization preserves an acceptable level of accuracy of the model that makes it an important optimization technique for edge applications.
Regarding the quantization of a weight tensor (\(\:V\)) with the floating-point values, the values are converted to lower-bit integers as shown in Eq. (12).
$$\:{V\left(\frac{{V}_{float}-{min}\left({V}_{float}\right)}{{max}\left({V}_{float}\right)-{min}\left({V}_{float}\right)}.\left({2}^{a}-1\right)\right)}_{int}$$
(12)
Where: \(\:{V}_{int}\)represents the quantized weight tensor, \(\:{V}_{float}\) represents the original floating-point weight tensor, \(\:{min}\left({V}_{float}\right)\) as well as \(\:{max}\left({V}_{float}\right)\)remains the minimum as well as maximum values within \(\:{V}_{float}\), \(\:a\) serves as the number of bits utilized for quantization. Enhances the inference performance by incorporating integer-optimized hardware.
Pruning reduces the complexity of a model by eliminating neurons or weights that are below a predefined threshold. This makes the model more computationally efficient without sacrificing important features by lowering the number of parameters. Pruning is appropriate for real-time applications since it speeds up inference and lowers computing costs. Up to 50% of the model’s size can be decreased using this method without noticeably affecting performance. Pruning makes it possible for lightweight, quicker models that function well on devices with limited resources in the context of CPS security. Some of the techniques under pruning include the process of removing some of the least significant weights or neurons in the model. This strategy helps cut down the number of variables required as well as the number of computations that need to be made, which improves the model’s performance. Of these, the most widely used are the magnitude pruning and the organized pruning. The magnitude Pruning Equation (utilized in this research) is given by Eq. (13).
$$\:V{\prime\:}=\left\{\begin{array}{c}Vif\left|V\right|>threshold\\\:0otherwise\end{array}\right.$$
(13)
Where: \(\:V\) indicates the original weight tensor, \(\:V{\prime\:}\)represents the trimmed weight tensor, a threshold the specified number below which weights are pruned. It effectively Saves the model size and also the computation required to predict the target variable. However, this model contains an entropy loss function as stated in Eq. (14).
$$\:L=-\frac{1}{M}{\sum\:}_{l=1}^{M}{\sum\:}_{d=1}^{D}{x}_{ld}{log}\left({\widehat{x}}_{ld}\right)$$
(14)
Where: \(\:{x}_{ld}\) indicates the ground truth, \(\:{\widehat{x}}_{ld}\) represents the anticipated probability of class \(\:d\)for the\(\:{j}^{th}\) sample, \(\:M\) represents the number of samples, \(\:D\) represents the number of classes. In an Industry 5.0 environment, aided by quantization and pruning, the lightweight design of MobileNetV3 supports the scaling of the system to cope with increasing volumes of data while maintaining light loads on edge devices. Distributed edge computing further accelerates data processing to ensure low latency and high efficiency. After performing the process of feature extraction, calculation of distance and the initial stages of processing on MobileNetV3, the model performance gains a further boost via Chaotic Tent-based Puma Optimization (CTPOA) algorithm.
Fine-tuned using chaotic Tent-based Puma optimization (CTPOA)
CTPOA is one of the variants of the Puma Optimization Algorithm, an optimization technique that draws inspiration from the hunt behavior of pumas. This POA-enabled procedure essentially manages a balanced exploration or exploitation trade-off that becomes pertinent in optimizing the highly complex and high-dimensional parameter space of a deep learning model such as MobileNetV3. These features and abilities lead to a computationally light algorithm capable of running in highly resource-constrained environments such as edge devices. The convergence speed and accuracy of the algorithm are further enhanced by the chaotic tent map, in particular, making it suitable for efficiently fine-tuning models in a highly dynamic Industry 5.0 environment.
The CTPOA algorithm initializes a population of pumas in the search space with arbitrary locations, which represent potential solutions to the optimization problem to be solved. Then it sets values for its parameters, such as control variables, acceleration factors, and maximum iterations. A fitness function is defined to evaluate the different solutions, which typically corresponds to the loss function of the deep learning model in question (MobileNetV3 in this case). The fitness function allows us to assess how fit each puma present in the population is, in terms of the quality of the candidate solution. Within this context, the fitness function defined in Eq. (15) serves to determine the minimization of the loss function of MobileNetV3:
$$\:Fi{t}_{ness}={min}(L)$$
(15)
POA is a metaheuristic algorithm inspired by the pumas’ hunting and social behavior in the wild.
Stalking behavior
In this phase, the pumas change their positions in the search space in the direction of the prey (i.e., the best solution found so far) defined in Eq. (16)
$$\:{Y}_{j}\left(r+1\right)={Y}_{j}\left(r\right)+{r}_{1}\cdot\:\alpha\:\cdot\:\left({Y}_{best}\left(r\right)-{Y}_{j}\left(r\right)\right)+{t}_{2}\cdot\:\beta\:\cdot\:{G}_{j}\left(r\right)$$
(16)
Where: \(\:{Y}_{j}\left(r\right)\)represents the position of the \(\:{j}^{th}\)puma at iteration \(\:r\), \(\:{Y}_{best}\left(r\right)\)represents the best solution found so far, \(\:{t}_{1}\)and \(\:{t}_{2}\)are random numbers in the range [0, 1], \(\:\alpha\:\)and \(\:\beta\:\) are control variables.
Hunting behavior
Puma cats actually rush forward on better speed, cutting the prey insightfully so that K increases, as expressed in Eq. (17).
$$\:{Y}_{j}\left(r+1\right)={Y}_{j}\left(r\right)+{t}_{3}\cdot\:\gamma\:\cdot\:\left({Y}_{best}\left(r\right)-{Y}_{j}\left(r\right)\right)+{t}_{4}\cdot\:\delta\:\cdot\:{W}_{j}\left(r\right)$$
(17)
Where: The puma’s velocity is represented by \(\:{W}_{j}\left(r\right)\), where \(\:\gamma\:\) and \(\:\delta\:\) are acceleration factors \(\:{t}_{3}\) and \(\:{t}_{4}\) random standards within the range [0, 1].
Pouncing behavior
According to equation number (18), pumas perform a fast pounce on their prey.
$$\:{Y}_{j}\left(r+1\right)={Y}_{j}\left(r\right)+\eta\:\cdot\:\left({Y}_{prey}-{Y}_{j}\left(r\right)\right)$$
(18)
Where: \(\:{Y}_{prey}\) represents the prey’s position, whereas \(\:\eta\:\) is a pouncing factor that determines the amplitude of the jump. The processing algorithm will iterate through these phases, updating the positions until a termination criterion is met (e.g., maximum generations or convergence in space fitness).
Chaotic tent map
The chaotic tent map combines this nonlinearity and unpredictability to prevent the algorithm from trapping in local minima, thus improving exploration. It is mathematically defined as shown in Eq. (19)
$$\:{y}_{m+1}=\left\{\begin{array}{c}\frac{{y}_{m}}{b},if{y}_{m}
(19)
Where: \(\:{y}_{m}\)represents the system’s state at iteration \(\:m\), \(\:b\) denotes a parameter that normally lies in the range (0,1). The Tent Map provides a sequence of variables within the interval [0,1] that can display chaotic behavior based on \(\:b\).The final solution is the best position found after all iterations. Table 3 shows the pseudocode of the proposed CTPOA.
Advantages of CTPOA:
-
The chaotic tent map greatly improves convergence speed and prevents premature convergence to local optima.
-
CTPOA balances the exploration of the search space with exploitation of promising solutions.
-
Effective in computational efficiency: it is light in computation, suitable for edge devices.
-
CTPOA is robust under complex, high-dimensional optimization problems.
-
As fine-tuning specificity, CTPOA excels at fine-tuning the parameters of the already trained MobileNetV3 model.
Following the anomaly detection and classification performed by MobileNetV3, fine-tuned by CTPOA, the security of the processed data within the Cyber-Physical System (CPS) is further enhanced using AES encryption and Discretionary Access Control (DAC).
AES encryption discretionary access control for data security
AES encryption is effective against DDoS attacks because it guards against illegal access and data manipulation, guaranteeing data confidentiality and integrity in CPS. Discretionary Access Control (DAC) ensures that only authorized users can interact with vital systems by restricting access to sensitive data. By limiting user access and safeguarding communication, the AES and DAC work together to protect CPS from outside threats. AES (Advanced Encryption Standard) is one of the most used encryption techniques that secure data with the help of a symmetric key. It was created through the United States NIST in 2001 to succeed the DES and is considered to be fast, secure, and efficient. In CPS scenarios, the confidentiality and integrity of sensitive data are guaranteed by the combination of AES encryption and discretionary access control (DAC). AES is a popular, quick, and reliable encryption system that is essential for protecting data sent over potentially weak networks. AES encryption’s computational complexity causes latency, which impact real-time applications, particularly when handling massive amounts of data. This effect causes responses to time-sensitive operations to be delayed in contexts with limited resources, such as edge devices. AES-128 reduces this delay without compromising security.
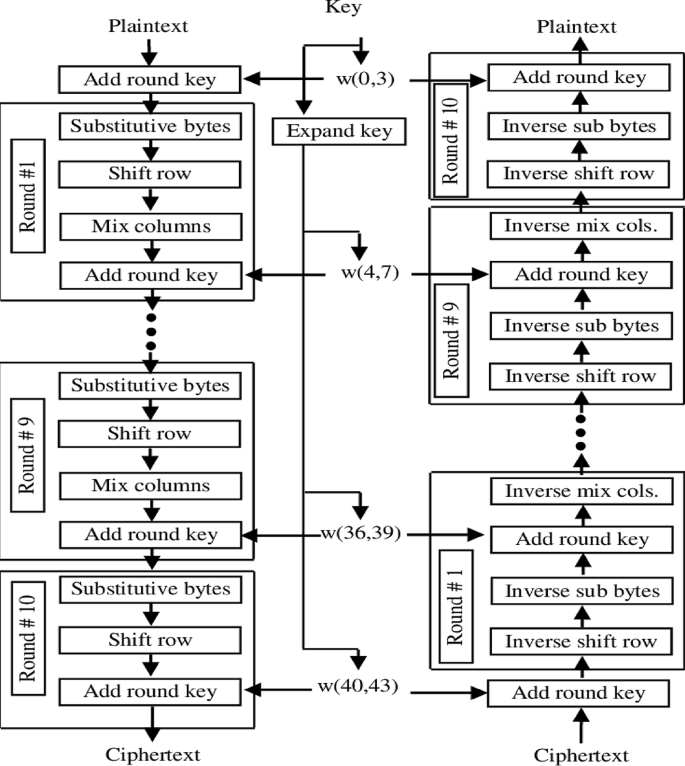
AES operates on 128 binary digits of data as well as can take key sizes of 256 bits. The encryption process involves several transformations and the amount of these transformations hangs on the key scope – 10 for the 128-bit key, 12 for the 192-bit key, as well as 14 for the 256-bit key. Every round has multiple operations, such as Each round has multiple operations, such as:
✰ SubBytes: Strategy in which a non-linear substitution step replaces every byte in the block by an S-box or substitution box.
✰ ShiftRows: A transposition step cyclically shifting the rows of the state.
✰ MixColumns: Combines the columns in the state to provide diffusion.
✰ AddRoundKey-Step in which one round key derived from the original cryptographic key is added.
Decryption reverses these steps to recover the plaintext.
Security of AES
AES is considered highly safe and is the standard method of encryption used in many different applications from the protection of data in government communications to the encryption of data on consumer devices. Its security is based on its ability to resist certain types of attacks that are known as cryptanalytic, for example, linear and differential ones. The several key size variations make it difficult for an attacker to guess the correct key therefore preventing brute force attacks. Figure 6 shows the AES workflow.
The proposed system’s security framework is validated using formal and informal security evaluations. ProVerif, a tool for formal analysis, is employed to confirm the integrity, confidentiality, and authentication of the cryptographic protocols, specifically the AES encryption applied to the processed data. ProVerif uses applied π-calculus to model the AES encryption and data flow, testing for vulnerabilities such as data leaks or unauthorized access to the outputs of MobileNetV3. Additionally, Scyther is used to display attack traces in finite sessions, assessing protocol security against risks like replay or man-in-the-middle attacks, ensuring the secure transmission of the model’s predictions and optimized parameters. These formal analysis tools work together to guarantee that the communication and cryptography protocols are secure and resilient to rigorous examination. For informal analysis, threat modeling is conducted to identify potential hazards, including DDoS attacks, spoofing, and insider threats that could compromise the data processed by MobileNetV3. The system’s durability under severe conditions is tested through simulations, validating the efficacy of AES encryption and Discretionary Access Control (DAC) measures in realistic attack scenarios. This dual-layered strategy, combining formal verification and informal testing, strengthens the security validation of the entire system, ensuring the protection of the data and insights derived from the optimized MobileNetV3 model.
Discretionary access control (DAC)
Discretionary Access Control (DAC) is a prevalent access control model that enhances the security of information systems, including those processing data from MobileNetV3 and optimized by CTPOA. DAC controls user access to information resources based on their identity and the permissions assigned by the resource owner. In the context of our system, this means that access to the outputs of MobileNetV3, the optimized parameters from CTPOA, and the underlying data within the IoT23 dataset is managed based on user roles and permissions.
This model is among the primary and most flexible access control architectures, allowing the owner to control access to resources and specify their usage. Under the DAC system, control access permissions for any resource (whether it is a file, folder, database entry, or in this case, the results of the deep learning model) rests solely on the owner or creator of that resource. Users are either allowed or disallowed to access content based on the owner’s discretion. The permissions are typically categorized as follows:
-
Read: Allows users to view the contents of the resource, such as the classification results from MobileNetV3.
-
Write: Allows users to modify or delete the resource, such as updating optimized parameters from CTPOA.
-
Run: Allows users to execute the resource, such as running a script that utilizes the model’s outputs.
-
Full Control: Grants users the authority to alter permissions and take ownership of the resource, encompassing all other permissions.
Discretionary Access Control provides a user-centric approach to data security, ensuring that only authorized individuals can access and manipulate the sensitive data and model outputs generated by the system. This is crucial for maintaining the integrity and confidentiality of the insights derived from MobileNetV3 and CTPOA, especially in resource-constrained edge environments.
The scalability of the proposed algorithm in handling the increasing number of IoT devices and high data volumes in CPS settings remains an important consideration. Table 4 shows the summary of the proposed method with its advantages and limitations. While MobileNetV3 ensures computational efficiency for edge devices, its performance in large-scale networks with diverse devices and dynamic data traffic needs further analysis. The Chaotic Tent-based Puma Optimization (CTPOA) may face challenges with increased parameter tuning complexity in extensive deployments. Additionally, the preprocessing pipeline’s computational overhead could become a bottleneck as data scales up. Future research should test the system’s performance in bigger, actual CPS networks to assess its scalability.
Interpretability and explainability of the model’s recommendations
To foster understanding and trust in the deep learning-based security model’s recommendations, interpretability and explainability are paramount. Our model generates actionable recommendations for mitigating cyber risks in CPS by providing insights into its decision-making process.
Specifically, after the initial feature extraction using ResNet-101 and the subsequent processing by MobileNetV3, this study employs techniques like Class Activation Mapping (CAM) to visually represent the input data features that most significantly influenced the model’s predictions. This allows users to understand why the model made a particular decision, enhancing transparency.
Moreover, the CTPOA-guided optimization method provides additional insight into the model’s behavior by enabling us to trace the impact of specific hyperparameters on the model’s output. This allows for a deeper understanding of how the model’s performance is affected by different parameter settings.
By integrating these explainability techniques, beyond simply identifying and mitigating risks, our model fosters trust and provides valuable insights for practical applications. This facilitates a clearer comprehension of the recommendation-generation process, making the model more accessible and reliable for users in real-world CPS environments.”
link


%20(1).webp "Hackers Moving to “Living Off the Land” Techniques to Attack Windows Systems Bypassing EDR")


